Whole factory optimization
Manifold
Manifold lets us run simulations on our foundation model of the plant and explore the world of possibilities. The model holds the state of the processes inside the plant: parts, machines, shifts and breakdowns, and how each process depends on the others.
Manifold shows the plants a manufacturer could run, side by side, before anything on the floor is moved. Each one comes with its cost and its output, and with what it asks of the people who run it. It shows where the plant is constrained today, and where the constraint moves when something changes.
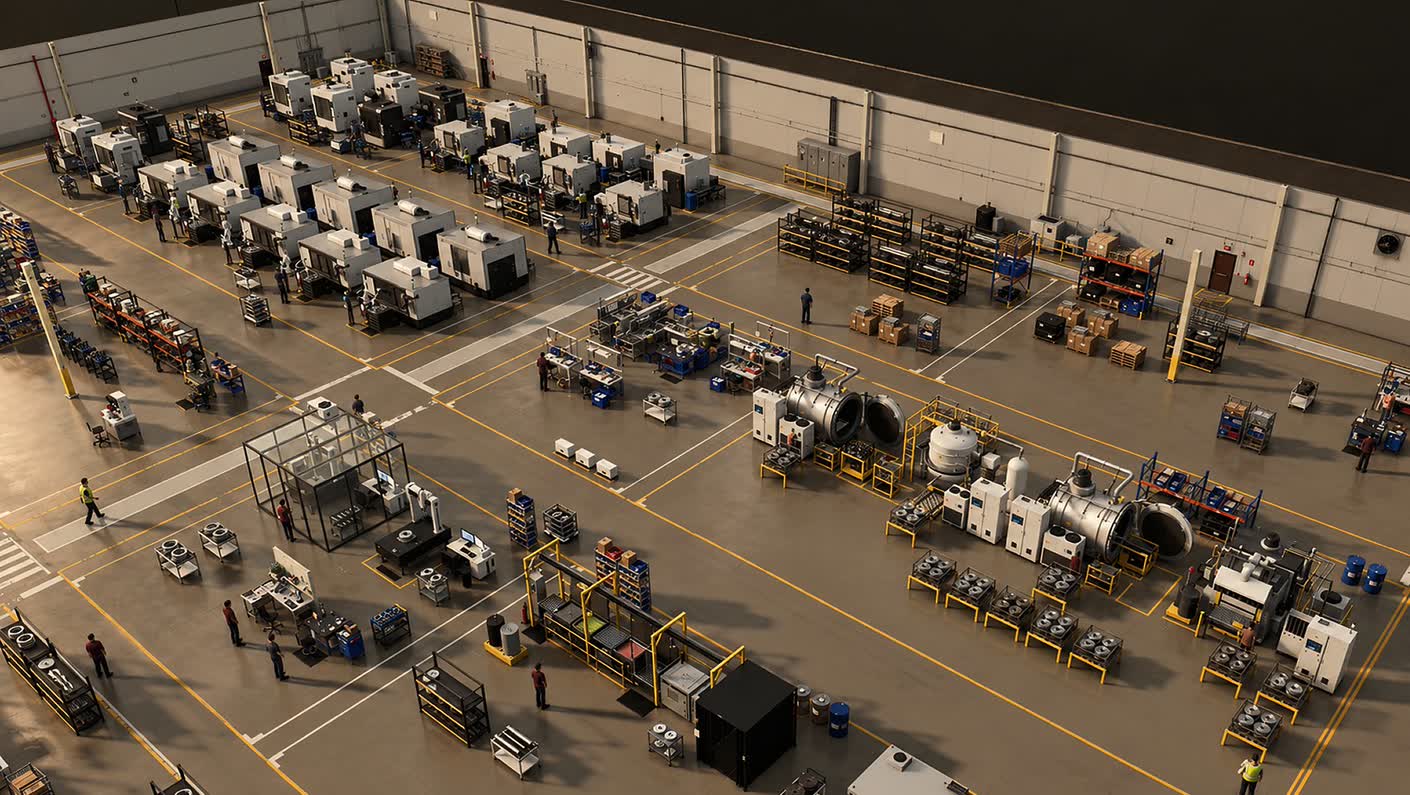
It starts with whole factory data
Whole factory data is high-bandwidth data on everything that’s going on in the factory: the process, the work, and the outcomes. It lets us understand capacity, and understand how adaptive the factory is.
This is the data people pick up on their own when they work in a factory. It gives each person intuition about their own role. That data can now be replicated and simulated, at a wider scope than any one person can manage.
A person sees the demand, or the problem, right in front of them. It’s hard for any one person to see the downstream effects and the upstream implications. For a person, the relationships within the data have to be obvious before they make sense. For machine learning, they don’t have to be obvious.
Higher-bandwidth data produces the answers we seek, as well as answers we didn’t know we needed.
We start by collecting data on the critical processes that we already know need to be optimized, and work from the inside out. In the end, the factory floor and the process are tracked and generalized. Whole factory optimization lets us properly allocate the factory’s capacity.
Why we built it this way
A gain at one machine is capped by the next constraint, so the thing to model is the whole plant. A running plant can’t be rearranged to see what happens, so we simulate it. The plant-level answer is only as good as what’s known about each machine and the robot tending it, so we simulate at two scales, the single cell and the whole plant, and feed what the cell runs show into the plant run.
One optimum hides the trade between automation and workforce, and the people deciding need to see that trade, so we keep a map of plants to choose from. There are far more candidate plants than can be simulated in full, so a fast prediction sorts them first. An answer nobody can explain doesn’t get built, so Manifold proposes an explanation and then tests it. And the plant that looks best can fail in its first bad week, so we look for where each one breaks.
What comes out
The answer is given in the plant’s own terms: what a conforming part costs, and how many the plant puts out.
People are part of the answer: who is redeployed, and which roles are created.
People go from managing production, largely through their labor, to managing capacity. We build technology that lets manufacturers empower their own people. The people already on the floor gain the skills to take on the engineering roles, and run the factory themselves.
The answer also gives the time: how many months until the plant is at steady state.
A point on the map
As the factory is optimized, the process itself changes. There is more room to experiment, with the process and with people’s roles. This is what leads to robotics, because a robot needs to work inside the factory with the same level of intuition that an operator, a manager, or a procurement officer has.
We start with whole factory optimization because it puts a point on the map, and the map is much larger than this one point. Supply chains and markets connect all these points together.